This post originally appeared on my substack.

The rate of profit is one of the most important macro metrics in classical economics and is key to understanding the health of a capitalist economy. When the rate of profit is falling the business cycle is entering its late phase. While it is rising the economy is relatively healthy. It is also empirically established to have a tendency to fall over time.
In this blog I’m going to lay out the classical rate of profit equations and how to view the rate of profit for the whole American economy with data up to date to the previous quarter.
So, first things first, how are we calculating profit. On the scale of the aggregate, profit isn’t calculated solely on what counts as profit for an individual enterprise. Rather, we’re interested in the value produced by the economy above the costs of production. This includes dividends, interest rates and taxes. In American national accounts, the best metric for macro-profit is “net operating surplus“.
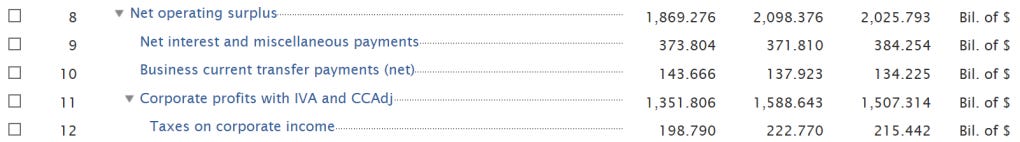
Net Operating surplus will be the numerator in our rate of profit equation, and US National Accounts breaks down net operating surplus for the whole economy, for private corporations, and for non-financial corporations. For the purpose of this blog we will focus on non-financial corporations. Some economists, such as Michael Roberts look at profit for the whole economy by taking the total net value added as profit and go directly to the data tables at the BEA website for this and estimates of the capital stock.
I am using data aggregated on the Federal Reserve’s FRED website which allows us to create custom dashboards, meaning that we can calculate the rate of profit on their website in a way that is automatically updated.
Now, we can move to the denominator of the rate of profit equation, which is the cost of capital. These costs are broken down into constant capital (c), and variable capital (v). Constant capital is the fixed assets, equipment and raw materials required to produce commodities. Variable capital is labor cost. Together they make up the entirety of the cost of capital (C), that is: c+v=C. Add in profits and you get the classical equation for cost plus pricing: Price=c+v+s where s is surplus/profit.
The rate of profit equation is therefore s/(c+v)
Variable capital is relatively straight forward, we are going to use the compensation of employees data from the gross value added national account statistics. Constant capital is more complicated, there are three different measures that we can use.
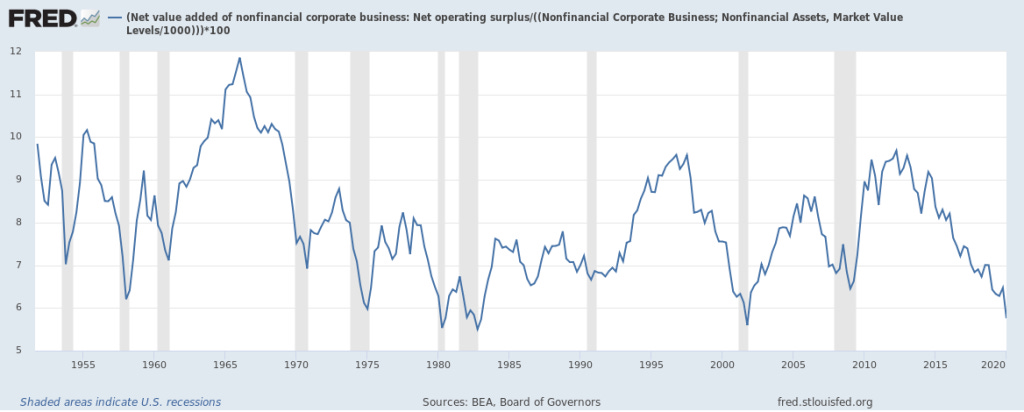
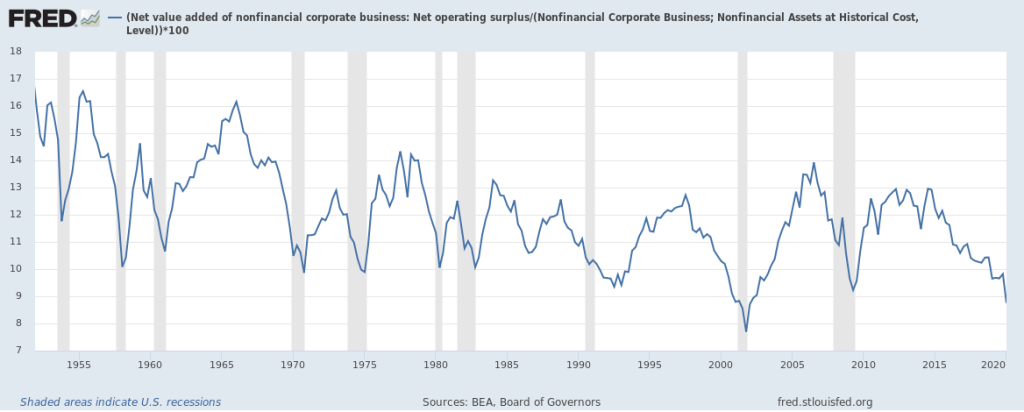
Most economists will look at the total capital stock, and calculate this stock either at historic costs (what firms actually paid), or market costs (the cost of replacing these assets). These are both nonfinancial asset stocks, equipment, buildings, inventories ect. Historic costs are simple, easy to calculate and are difficult to manipulate, but they have the downside of being easily influenced by inflation rates. Market costs are always up to date, but often times companies will use this accounting method to inflate their balance sheet and Net Worth.
There is a third option, however, that has to do understanding the cost of constant capital to be the cost of capital used up in the given period of time (the depreciation of machinery through wear and tear for example). We can approximate this by looking at the aggregate capital consumption. Capital consumption is, however, merely an estimate which is based upon the expected lifespan of the given asset. There is also not a consistent way that businesses calculate capital consumption across the economy, with each firm using its own method according to what will produce the most beneficial outcome for tax purposes.
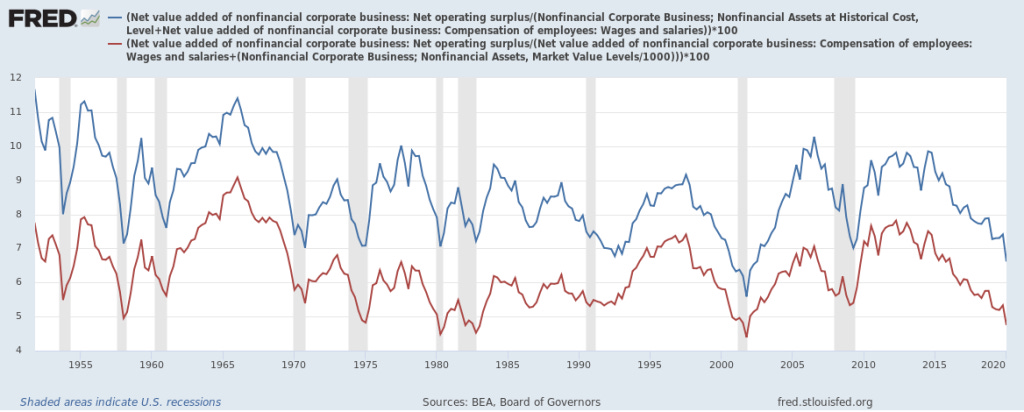
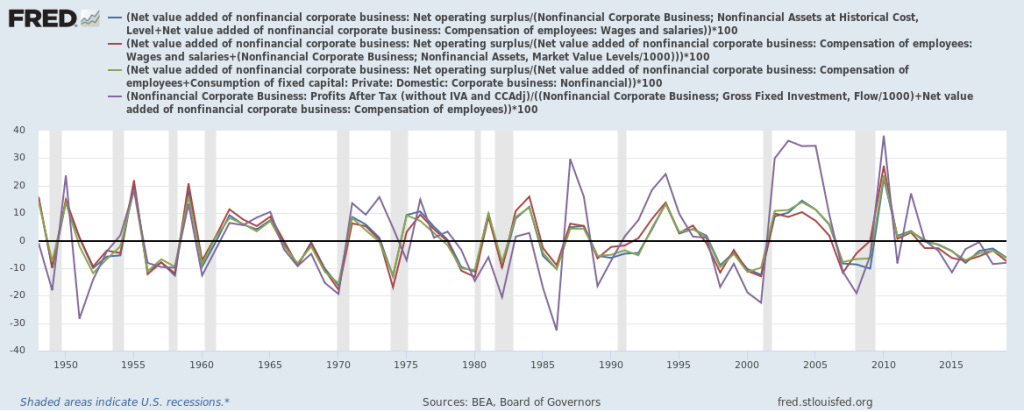
In the graph above is a comparison of the rate of profit calculated with historic capital cost vs market capital cost, with historic in blue and market in red. You can find an automatically updating version of this chart here.
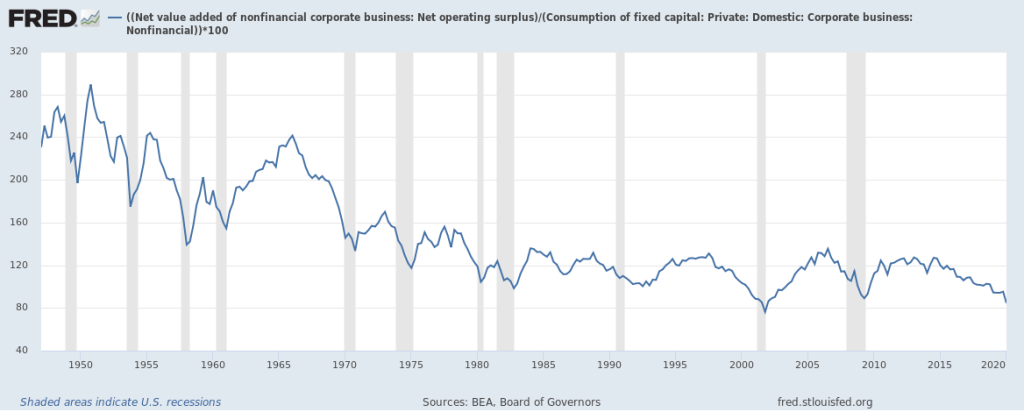
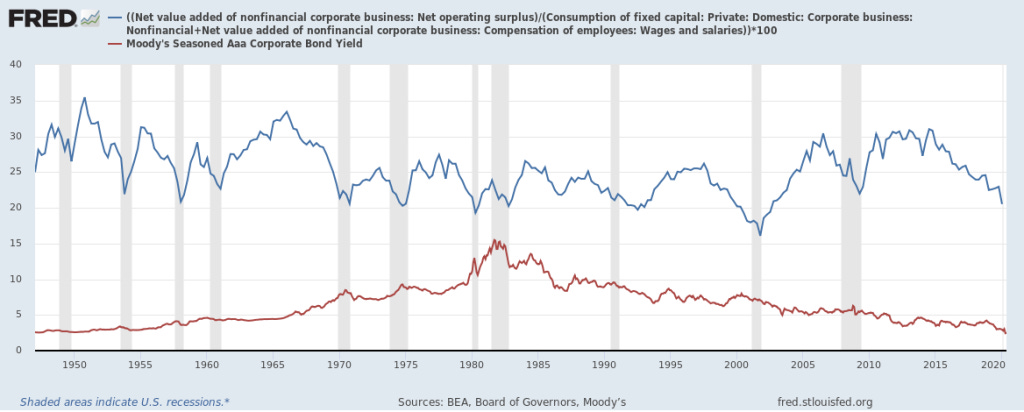
In comparison, here is the graph of the rate of profit calculated off of capital consumption.
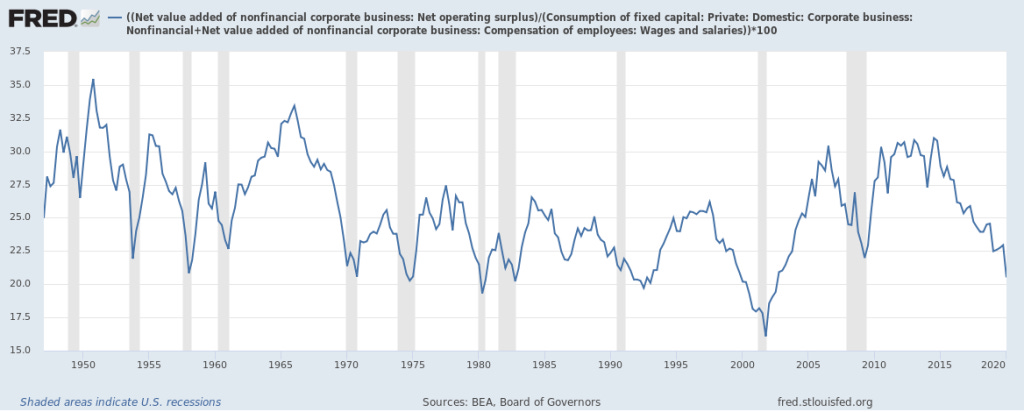
You might notice that the numbers are much higher for the capital consumption graph, this is because the historic and market capital cost graphs are calculated with the whole capital stock on the balance sheet, whereas the capital consumption of any given year of that stock will necessarily be much smaller.
Now that we have the rates of profit expressed graphically, the cyclical and secular trends are much more clearly. The rate of profit will trough during recessions and poor economic periods. There is also a slight secular downtrend, one which was theoretically suggested by classical economists such as Ricardo, Malthus and Marx.
We can see where these trends are coming from by breaking down the rate of profit equation P’=s/(c+v) into s/c and s/v.

Given this breakdown, it’s clear that the secular downward trend is largely driven by an increasing cost of constant capital, since the rate of surplus value (s/v) has been kept at a roughly flat trend. This is consistent with the classical theories which saw competition driving more and more investment into labor-saving technologies.
Marx argued that the rate of surplus value was likely to increase despite a falling rate of profit, due to falling real wages and rising levels of productivity. However, while we have seen such conditions since the 1970s this doesn’t necessarily translate into a higher rate of surplus value, since this ratio is calculated in nominal, not real terms. What is important to the individual capitalist is not so much his worker’s purchasing power, but the real cost of wages to him is the relative cost of money compared to profits – the nominal rate of return.
When it comes to determining which metric for the rate of profit is more useful, perhaps we can turn to another prediction of classical economics: that the rate of interest will never except in exceptional circumstances exceed the rate of profit. In the time period we are looking at, there is one such period which matches these exceptional circumstances: the Federal Reserve induced 1981 recession. During this recession, the Fed under the leadership of Paul Volcker increased interest rates to such an extent that it forced an economic contraction.
Given this extraordinary interest rate movement, perhaps the most reliable rate of profit metric will be that which falls bellow the corporate bond yield for that period, but otherwise rises above it.
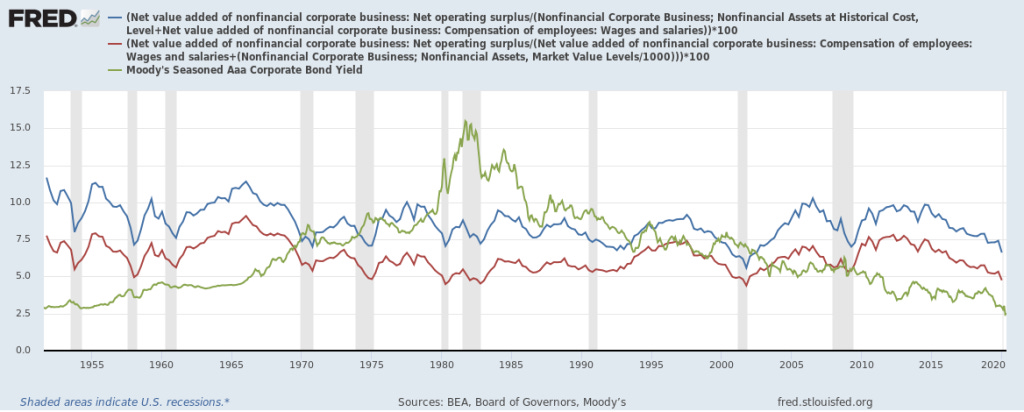
Out of all these metrics, the historic cost rate of profit does the best. But I also think that it may not be best to consider the impact of the interest rate in this way – the total capital stock will not tend to respond to immediate changes in the interest rate, and the capital consumption is only an accounting measure. It has less impact on how capitalists actually invest.
Net operating surplus too has its limitations here since it includes interest payments, it can’t capture the chilling effect on productive investment that interest rates rising above profit rates would have. To capture this effect, I’ve instead created a rate of profit metric based on how much money the capitalist puts up-front for a production period. Here, s equals after tax profits, c equals fixed asset investment (rather than stock or consumption), and v still equals labor compensation.

This graph fits the interest rate phenomena described by the classical economists best, but it also lacks the secular downward trend of the others. It is, however, just as cyclical.
This cyclical nature of the rate of profit can be very useful for predicting recessions. There has not been a recession which has not been preceded by a negative percent change in the annual rate of profit in the post-war period besides the 1981 Fed induced recession during stagflation. And while they were not quite general recessions, the strain of the Vietnam war, the 1986 Savings and Loans crisis and 2015 Manufacturing Recession also show up in the data.
A low average rate of profit usually entails many unprofitable firms, it reveals the fragility of the economy. Capitalists think in terms of rates, rather than absolute levels, which is why they are so obsessed with yield and the rate of return. A low rate of profit for productive enterprise means more desperate behavior, investors chasing riskier assets, businesses pursuing extreme cost-cutting measures and funny accounting methods to get out of trouble and turning to debt to pay operating costs. There is much debate in economics whether recessions are caused by internal contradictions or external shocks, but the fact of the matter is that a healthy economy is one which can survive all manner of shocks.
Today, there are many arguing that a coronavirus recession will be a short-lived “V-Shapes” recovery on the basis that the economy was humming along before the virus. But this doesn’t match the facts. The rate of profit (a metric of the real economy!) was re-testing historical lows by all measures, even as other signs of weakness were clear including the inverted yield curve, slowing growth and contraction in job openings. Once unprecedented government cash injections into households end, we’ll see just how healthy that pre-covid economy was.
All these graphs and more can be found on this customized dashboard, which is automatically updated by the FRED website.
Michael Roberts passed this on to me. This is one of the best articles I have read on the rate of profit, its movement and the effect of its movement. A few points. Variable capital is not annual compensation. To obtain variable capital annual compensation is divided by annual turnovers. The formula for this based on the SNA if GO/GVA +(GO-GVA)/GVA where GO = gross output and GVA = Gross Value Added. All data can be found on the BEA site GDP-by-industry. Not only is variable capital a quarter that of annual compensation it is also dynamic and responsive to the business cycle because the rate of turnover accelerates or decelerates depending on the phasing of the business cycle. However I tend to use circulating capital rather than variable capital in the denominator of the rate of profit because circulating capital better captures the growth of outsourcing as well as growing software inputs. The formula for circulating capital is annual gross output less the annual net surplus equals cost of annual gross output which when divided by annuals turnovers yields circulating capital per period. I take your points on valuing constant capital but that is a discussion for later. My immediate concern with constant capital is the conversion of Research & Development and in-house software from an input or cost into capital because of the 2012 SNA revision which has distorted both investment, depreciation and the value of constant capital.
Keep up the impressive work. If you want to see my analysis please visit theplanningmotive.com.
Kind regards
Brian.
I think one potential problem with beginning from gross output is that you can’t zoom in on private industry, which I zoom in on in the secular RoP post.
That’s a very interesting perspective, though I’m a little confused. For the circulating capital rate of profit you’re describing it’s essentially this:
Net Operating Surplus / ((Gross Output – Net Operating Surplus)/ Annual Turnover)
Or is it
(Net Operating Surplus / (Gross Output – Net Operating Surplus))/ Annual Turnover
Also could you clarify that annual turnover equation.
If you’re curious about further work I’ve done on profit rates I’d highly recommend my follow up post: https://casperforum.org/blog/the-secular-rate-of-profit/