This post originally appeared on my substack.
Recently I’ve come to realize that I should summarize much of my recent work on the implications of the current tendencies of the rate of profit into one place. Previously, I’ve written about the cyclical aspect of the rate of profit, as well as how simulating it can show its various possible dynamics. Here I would like to discuss the present secular trend in the rate of profit, and how it relates to class struggle in the United States in particular.
To recap, the rate of profit is measured by surplus over costs, such that S = Surplus, C = Constant Capital (machinery and fixed costs), and V = Variable Capital (wages and variable costs). While imperfect, I’ll be using data directly from the federal reserve website as it’s very easy to manipulate and verify. Because capitalists depend on surplus for their income as well as money for future investment, it’s essential for measuring the health of a capitalist economy from the perspective of the bourgeoisie. To get the most complete picture of these secular trends I’ll be using the national income data series from the federal reserve which shows net operating surplus for all enterprises, the capital consumption (depreciation), and compensation to employees. The annual version of this data series goes back to 1929, just before the great depression, and the quarterly version ends in Q3 2021 as of writing.
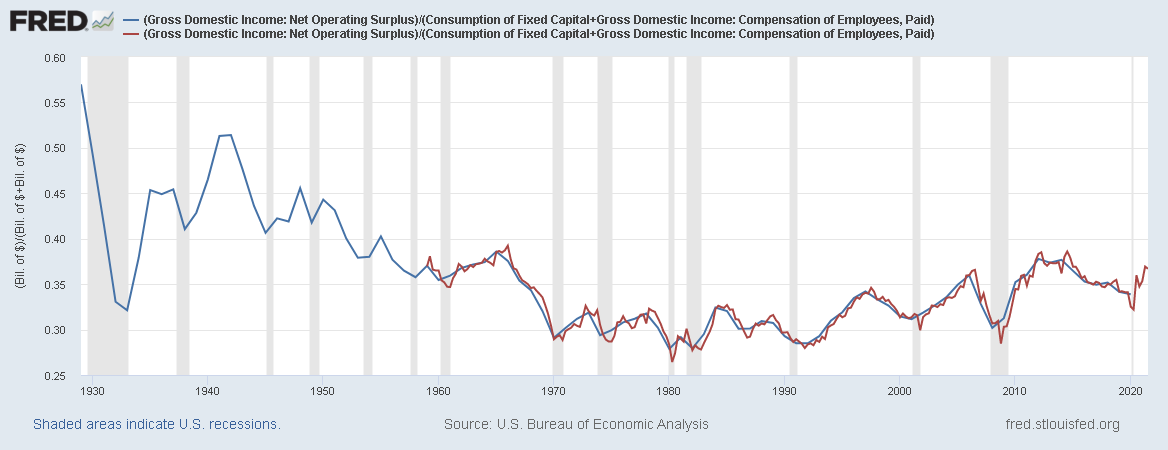
From here we can see a clear secular decline in the rate of profit from where the series begins all the way until 1980. From there it broadly stagnates, with a slight increase over time.
We can further decompose the rate of profit by looking at surplus relative to capital consumption and employee compensation (variable capital). The ratio of surplus to variable capital is also called the rate of exploitation, and the ratio of surplus to capital consumption is also called the organic composition of capital. Because wages are generally larger than depreciation, I’ve made the graph a double Y axis to show the changes over time.
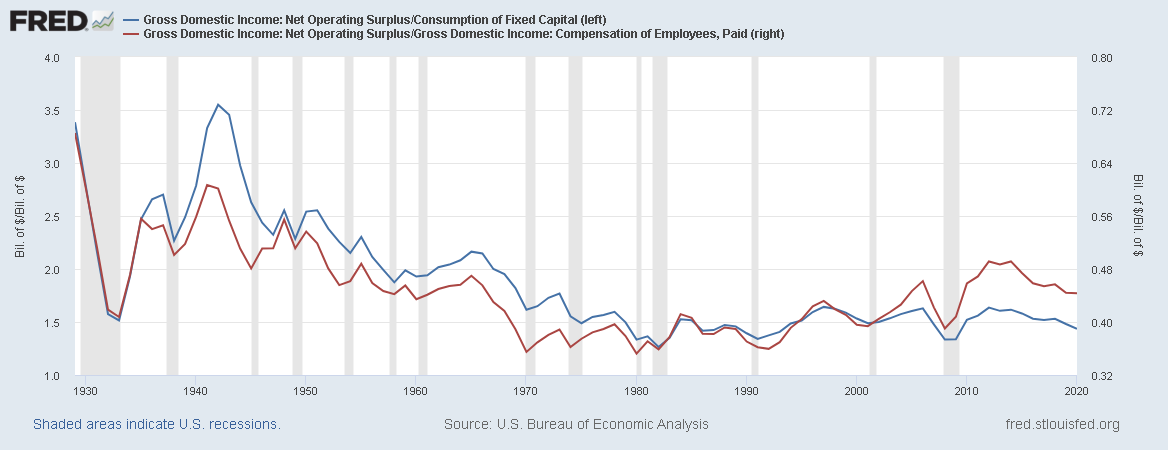
Neoliberalism has seen something of a recovery in the rate of exploitation, which is rather intuitive, which is largely responsible for the slight recovery in the rate of profit.
Marx’s thesis was that an ever increasing amount of constant capital relative to surplus would be the factor which drives the secular decline of the rate of profit. In the pre-neoliberal period it was clear that both a falling rate of exploitation and rate of surplus to constant capital were driving the secular fall. Indeed, there was good reason for this. When labor is more expensive, it makes sense to invest in machinery and increase labor productivity. Hence, there was always this contradiction in Marx’s immiseration thesis, which suggested higher rates of exploitation, and the tendency for the rate of profit to fall. The cheapness of labor, as well as the cheapness of money capital, can arrest the accumulation of constant capital in production.
To put into context these variables, we can look at what share of total income each factor represents. Red is labor, green is profit, blue is constant capital.
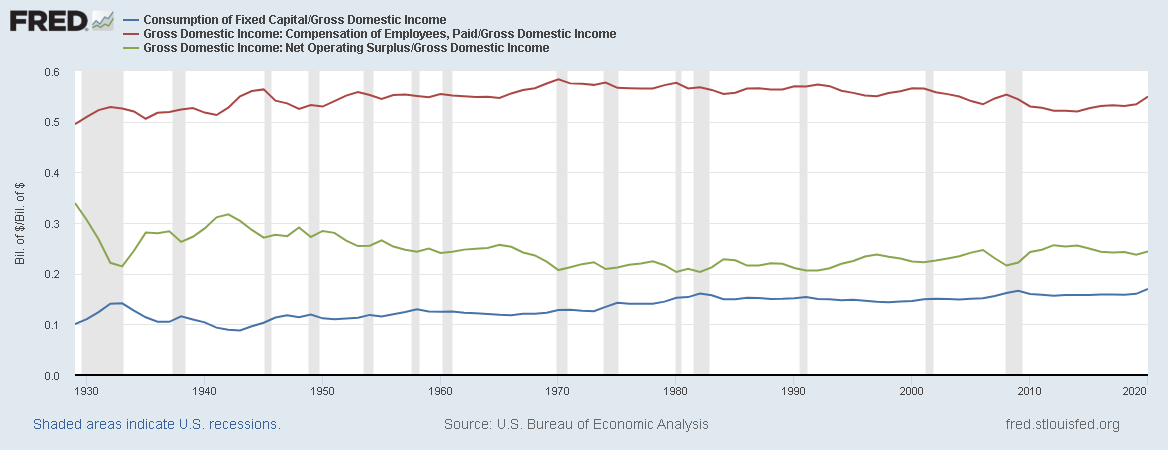
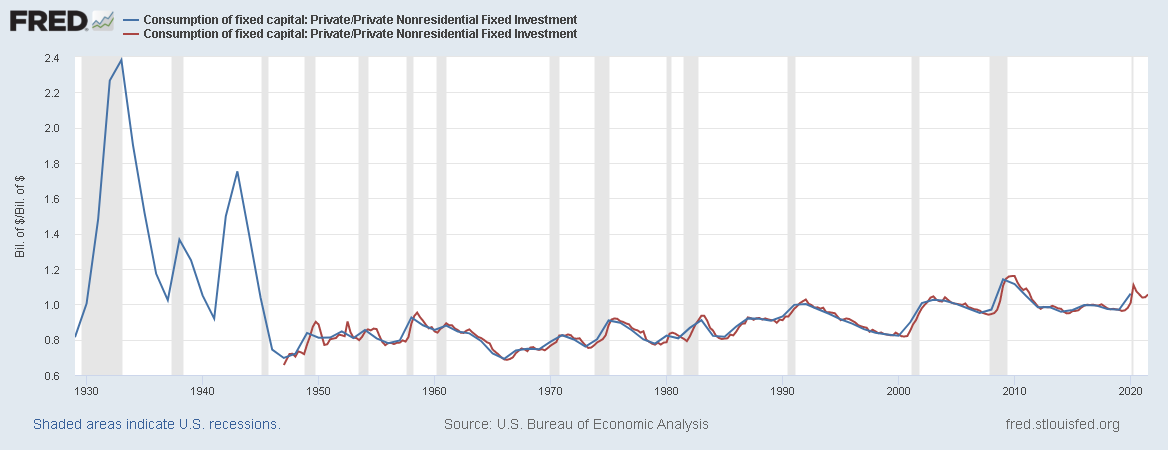
A notable feature is the convergence of surplus and constant capital, a finding consistent with my simulations. This is for a very simple reason, consumption of fixed capital is the measure of the constant capital destroyed in a given time period, used up in the process of production. Consumption of fixed capital is a flow variable, specifically the outgoing flow for the stock of fixed capital assets. The ingoing flow, however, is investment, and investment itself generally comes from the flow of profits to capitalists. When capitalists receive income they must make a decision on whether to invest said profits, which is necessary in some degree to maintain their status as a capitalist, or to consume it, which is necessary in some degree to maintain their life.
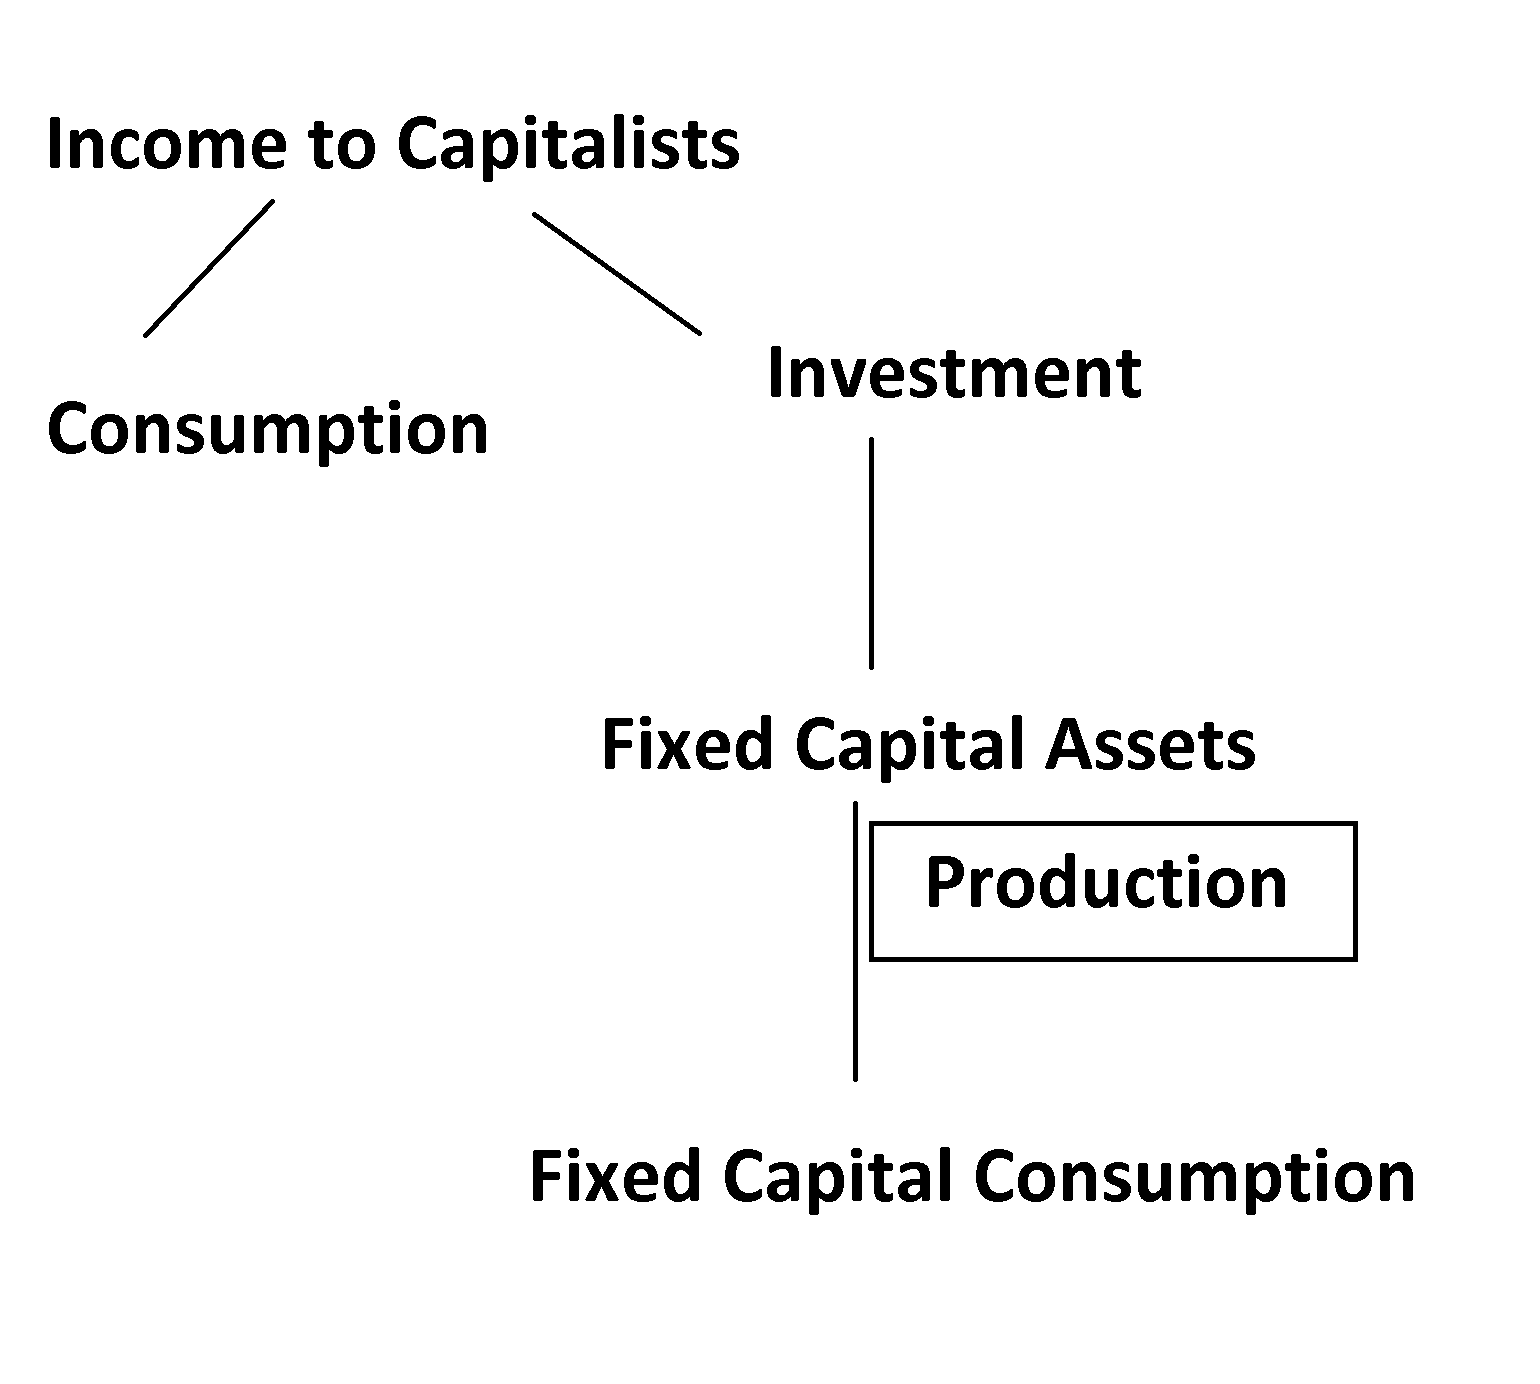
Thus, profits generally, in equilibrium, forms the upper limit of what capital consumption can be. So long as a capitalist class persits we can also expect profit to be generally greater than capital consumption, as some of that profit must also be diverted for their personal consumption.
When we compare capital consumption as a ratio to investment we can see this convergence, and how catastrophes like the Great Depression and World War II can drive it out of equilibrium. In the case of the Great Depression, this was accompanied by an also great decrease in surplus, however the destruction of capital in World War II permitted a vast rise in the rate of profit since it was not accompanied by such a similar drop in surplus.
But just because they have converged does not mean we are at the limits of investment. Some economists, such as Michael Roberts, suggest that constant capital as a share of value has stagnated because profitability is also low. However, if we look at investment as a share of net operating surplus it’s easy to see that this is not so simple.
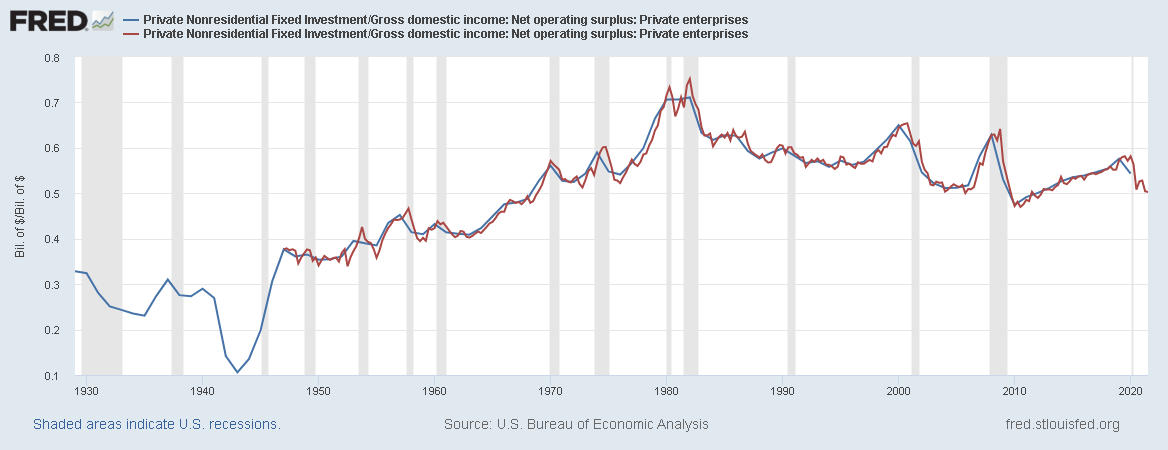
Investment as a share of surplus has decreased from over 70% in 1980 to nearly 50% today. This was a deliberate choice by the capitalist class, acting both as individuals making investment decisions, and as a class fighting for a political economy which would make such choices economically feasible, specifically through fighting for cheaper money capital and cheaper labor.
For the capitalist class, the profitability crisis of the 70s was an existential one, which threatened their existence as a class. If most of them could not subsist on profits, then the prophecy of Karl Marx in the end of Capital Volume 1 would nearly come to pass, with most capitalists destroyed by competition there would be little resistance to expropriation.
When it comes to subsistence, there is a better way to measure. We can look at after tax profits and subtract from that investment to see what income to capitalists was available for consumption, and then divide that by an inflation index to see real consumption potential.
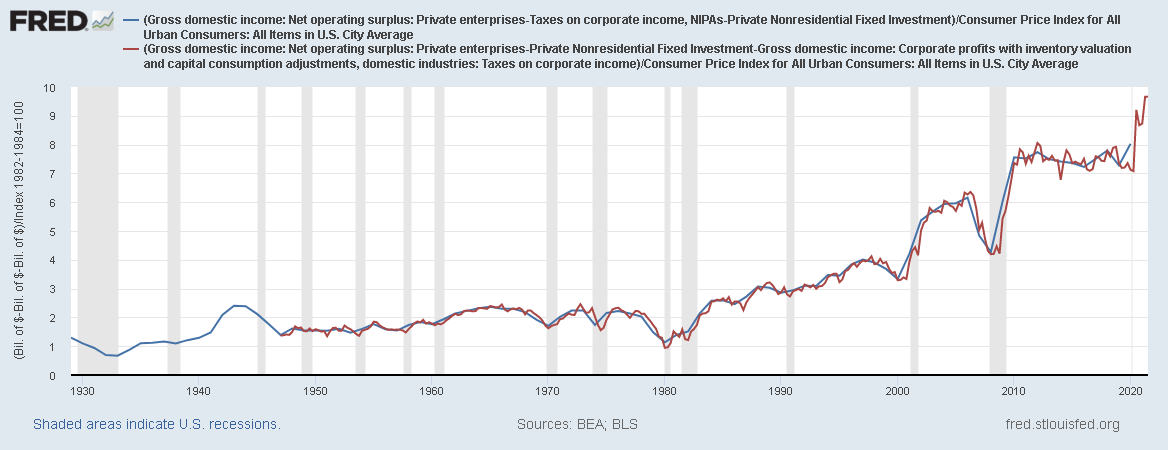
This graph represents in 1983 dollars what the whole of the capitalist class had in real income available for consumption. It’s startling in just how much it has risen in neoliberalism. A part of this is increasing income to the largest capitalists, driving income inequality.

But another part of this is simply the incredible amount of atomization of production, moving more and more income into the realm of profit, creating a vast army of petty bourgeoisie. While only a stand-in for this trend of atomization, we can look at trends in non-agriculture self employment for the scale of what happened.
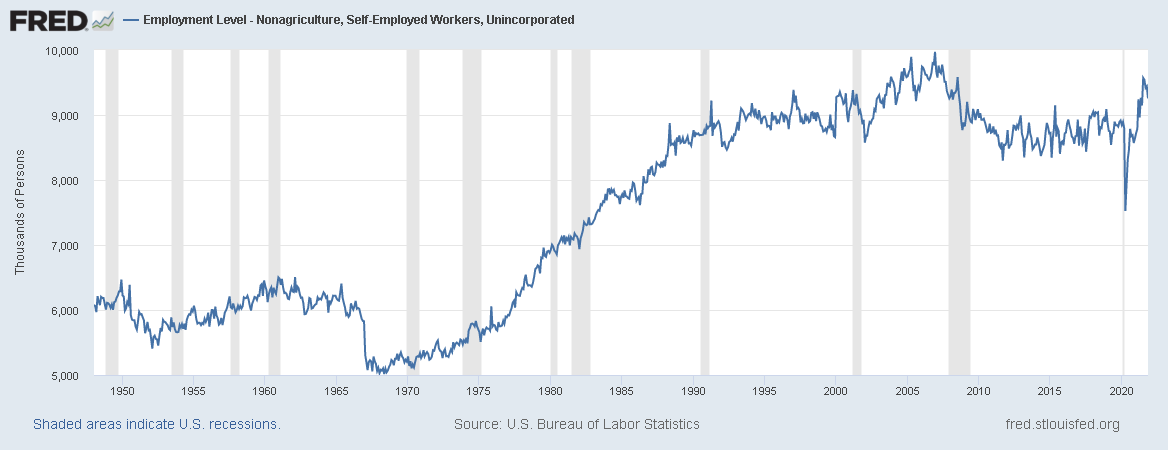
I have elsewhere detailed the political and economic consequences of this atomization, which has presently culminated in the class base for Trump style reaction and a new more militant anti-trust regime.
One of the consequences of a political economy based around preserving consumption potential for the capitalist class is, as mentioned earlier, is less investment, and with that, less technological innovation and scientific rationalization of production to increase labor productivity. Let’s recall the ratio of capital consumption and investment slowly creeping up towards 1 ever since the end of World War II, when it finally significantly rose above and then stabilized around 1, we saw the first change in trend around labor productivity in the US, that is, during 2008 and the immediate aftermath.
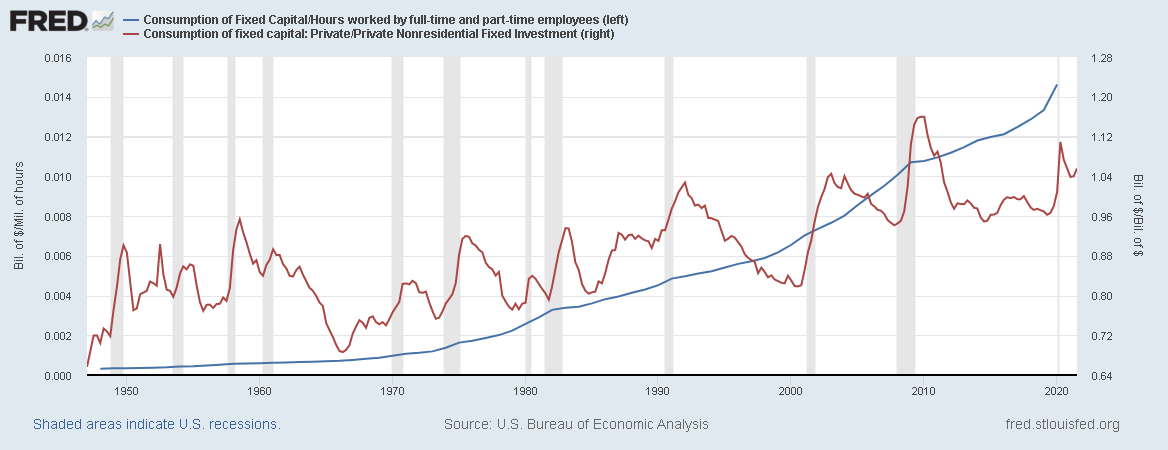
The financial crisis, in this way, saw destruction of the mass of accumulated capital for the first time in the United States since World War II.
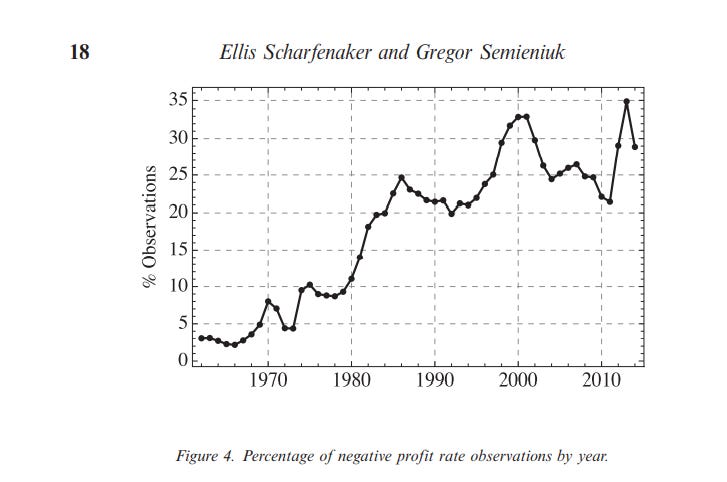
The political economy of neoliberalism, while preventing the continued collapse of the rate of profit in general, has also caused other problems. For while profits have been ensured for leading companies, rentiers and monopolies, it’s come at the cost of allowing ever greater negative profitability for firms on the other end of the distribution, the inevitable result of softer budgets.
See the results of this interesting study on the distribution of profit rates for public companies. The number of publicly trading companies with negative profits has risen from less than 5% in the 60s to about 30% today.
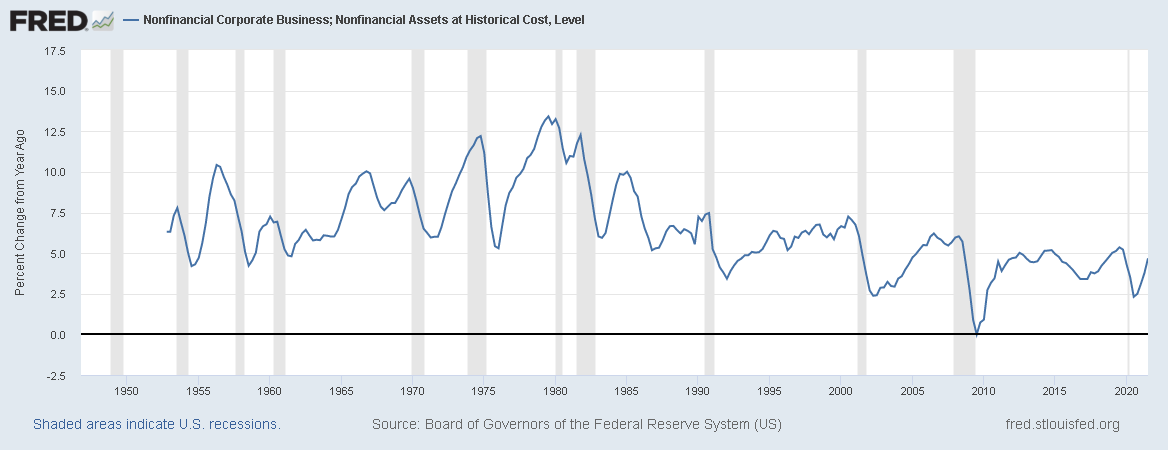
We can also see that the rentier economy has increased overall by looking at how the profits of nonfinancial corporations, which we can use as an ad hoc measure of profits on productive capital, have declined as a share of total surplus. More and more of surplus has been redistributed to non-productive capital since neoliberalism began.

What I have provided thus far is a diagnostic about the current secular trends in the rate of profit. The recent stagnation in the rate of profit and organic capital composition are summarily the result of an attempt by the capitalist class to forestall the teleology of Capital, which, when brought to its logical conclusion, leads to the destruction of said class. “One capitalist kills many” when left to their own individual interests. The political intervention of a class against its underlying economic logic is not unusual in history. The book Why Nations Fail is full of examples of such situations, though the authors are so entrapped in liberal capitalist ideology that they cannot imagine it happening to capitalism itself. Such interventions consign these societies to a slow end to economic development and historical progress.
The consequences for the capitalist class of a falling rate of profit at this stage are severe. But the consequences of it not falling, for the rest of us, is far more severe. The final consequences of the political economy required to stop its fall are the same responsible for the current reactionary nationalist turn in the United States, for holding back technological development, and for making working class political and economic self-organization extremely difficult.
It remains to be seen if new events set in motion by the recent crisis, such as increased worker militancy and state-led investment, will change these tendencies. One can only hope.
Hi,
Just discovering this site and your work, it’s great stuff. I had a (perhaps dumb) question: what’s the rationale for presenting the organic composition of capital as the ratio of surplus to consumption of fixed capital, rather than as the traditional ratio of constant to variable capital (C/V)? Am I missing a shortcut or something?